Last week we published data for the Midlands and North West, received from a Freedom of Information Act request to the Ministry of Justice concerning non-molestation orders and applications made under civil legal aid. We suspected that applications might have increased since the introduction of the Legal Aid Sentencing and Punishment of Offenders Act 2012 (LASPO). Such was the opinion of others we have spoken to.
The Act limited legal aid in private family law cases to ones where domestic violence was alleged. To provide a meaningful analysis, we’ve compared data between the first half of 2012 (before LASPO) and the first half of 2014 (after LASPO came into force in 2013).
Numbers for the Midlands and North West show a dramatic increase in applications in certain regions. Today we look at the South of England, and national statistics are provided below as a reminder of the national position.
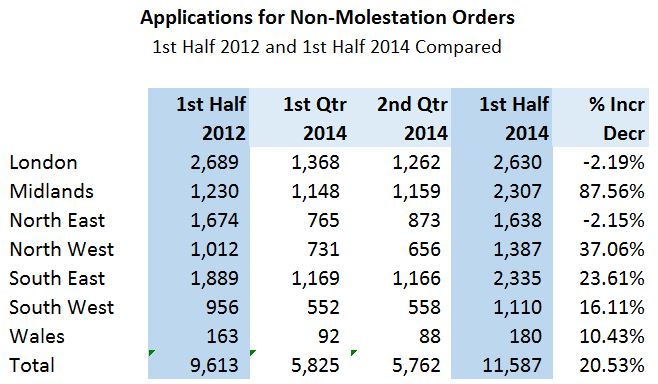
The South East of England
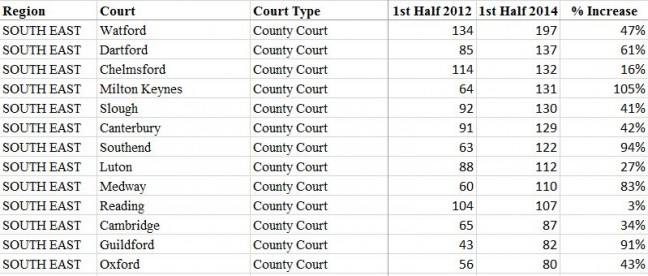
Very few Family Proceedings Courts record having made non-molestation orders in the South East, so we’ve ignored these and focused on numbers for County Courts.
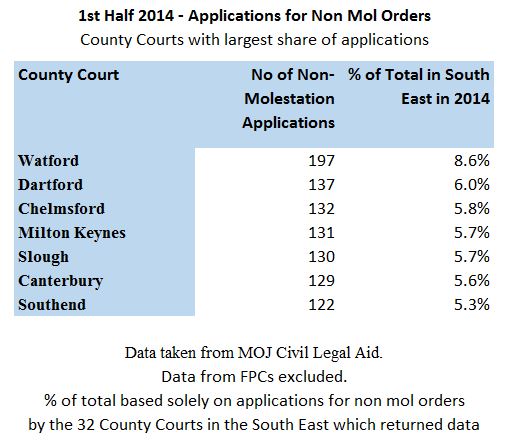
32 County Courts in the South East are recorded as having had non-molestation order applications in 2014. From each of the tables below, we’ve removed returns from courts where numbers are statistically insignificant (either in terms of the low percentage increase in applications, or the small volume of applications in that court).
So which courts stand out?
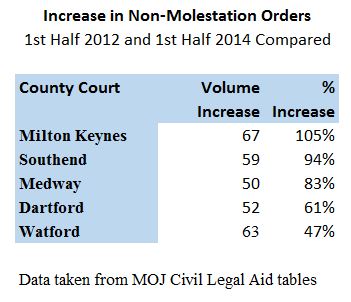
It is worth noting that there hasn’t been a recorded increase in non-molestation order applications in all courts. Norwich saw applications fall by 41% (a decrease of 34 applications), and there were similar falls in Ipswich and King’s Lynn. In total, 8 of the 32 courts saw a decrease in applications.
In terms of Milton Keynes, we note the geographic proximity to the Midlands. Could Milton Keynes be influenced by what appears to be the Midlands phenomenon (the substantial growth in applications in that region when compared to any other as a whole)?
South West
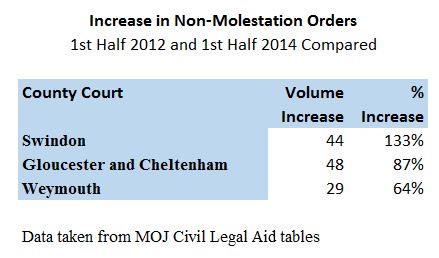
Again we’ve ignored data for the Family Proceedings Courts for the same reason given above. By far the greatest rise in applications in the South West (in terms of physical volume and in percentage terms) comes from the three County Courts listed in the table below. Spread over 6 months, they’re not particularly significant when compared to other regions.
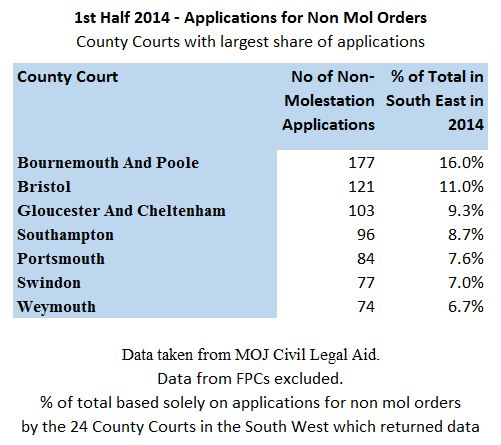
 Where are most applications made in the South West? The table below provides that data.
Population Density as an Explanation
Could population density account for the high number of applications in Bournemouth and Poole? Swindon has a population of 209,000 according to 2011 census data, while Bournemouth and Poole’s population was 183,000. Despite their population being 12.5% lower, the physical number of applications for non-molestation orders in the first half of 2014 was 130% higher than in Swindon. The oddity increases when you consider the population of Bristol, which is 5 times greater than that of Bournemouth and Poole. Another area for investigation?
Watford has a population of 90,300 (according to 2011 census data), yet the number of applications made was higher than in all of Wales, where the population is over 3million… and we’ll leave you with that thought.