
In yesterday’s article we shared how the growth in non-molestation order applications in the Midlands appears quite staggering. Today we’re sharing top level statistics for the national picture and North West in particular. There’s also something very odd related to Ministry of Justice (MoJ) statistics for Family Proceedings Courts.
As a reminder we’re comparing applications between the first half of 2012 (prior to legal aid being limited to cases involving allegations of domestic violence) and those in the first half of 2014. The question being did restrictions on legal aid prompt a growth in allegations of domestic violence?
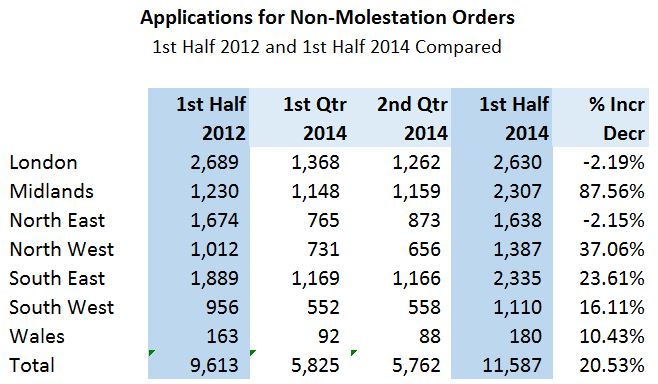
The statistics which have been made available from a Freedom of Information Act request to the MoJ are quite extraordinary. In London and the North East, there has been a modest fall in applications, while nationally, there has been an increase of 20%. Applications in the Birmingham County Court rose by 10 times the national average. In the Midlands as a whole, the increase in applications was 4 times the national average. The Midlands are not the only place where something odd is happening. It’s a regional rather than a national phenomenon with certain areas significantly impacting on national figures. Recorded applications in the West Midlands account for over 50% of the national increase.
The North West Anomaly
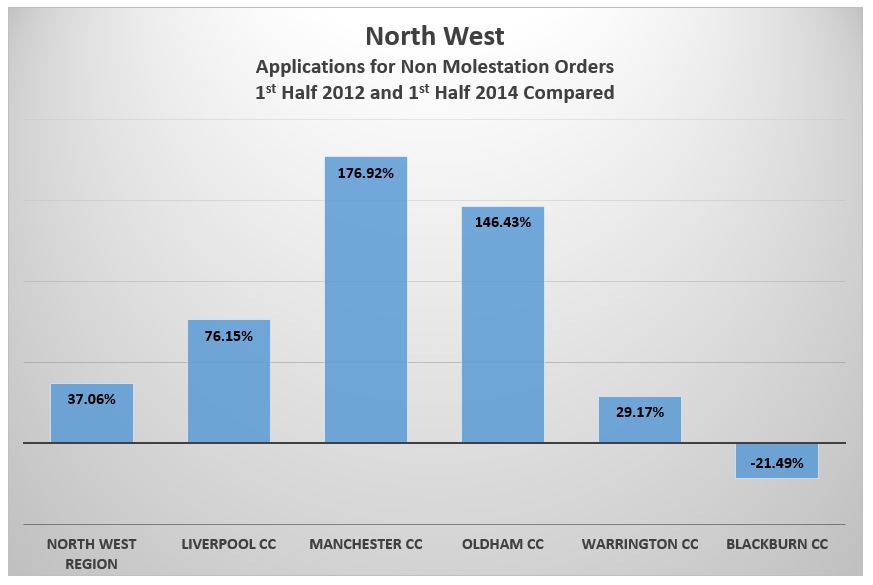
Across the North West, there is an overall increase of 37% from 2012 to 2014 (again, just looking at the first half of each year) while in the North East, applications fell. That said, from area to area within the North West, trends are very different, with the largest percentage growth being limited to the two largest cities… Liverpool and Manchester. In Manchester the percentage growth in applications is 9 times the national average, and a hefty 21 times the recorded growth rate in Leeds (where the increase was 8%). Compare this to London where applications appear to fall by 2% in the same period.
The North West percentage growth/fall in applications for non-molestation orders between the 1st half 2012 and 1st half 2014 is given below:
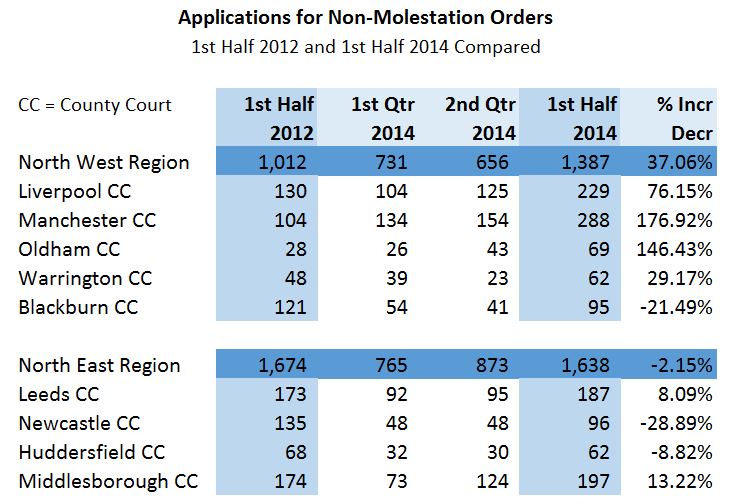
The physical number of applications are displayed below and we’ve included larger conurbations/courts in the North East for comparison (in numerical terms, the increase in applications in Manchester is particularly bizarre).
Family Proceedings Courts (FPCs)
MoJ statistics break down applications between family proceedings courts and county courts prior to the second half of 2014. We suspect that some regions were particularly good at doing their statistical returns to the Ministry of Justice while some were not, and the County Courts more organised and accurate than the FPCs. To put it bluntly, any other explanation is nuts.
Looking just at the first quarter of 2014 (before the Family Court replaced Magistrates and County Courts), FPCs in the West Midlands make up 80% of the national number of non-molestation order applications recorded by the MoJ. Would you expect those same regions to have been good at their returns in 2012 as well as 2014… yes. So while we suspect the MoJ statistics for FPCs (as opposed to County Courts) aren’t particularly robust (now there’s an understatement!), the statistical variance between yearly data for specific courts is worth examining… and once again Birmingham is very odd, as are courts across the West Midlands.
Need an example?
In the 1st quarter of 2012 there were 121 applications recorded by FPCs in the Midlands. In 2014, that rose by 162% to 344. For Birmingham FPC, applications rose from 7 to 136. A 1943% increase???
We’re left with one of three conclusions in relation to data on FPCs.
- Birmingham FPC was operating completely differently to any other FPC nationally; or
- The Ministry of Justice, when it comes to managing and monitoring statistical returns, doesn’t read or question the data themselves; or
- The data in relation to FPCs has been chomped by gremlins when the FOI response was put together or before it reached us.
Data for County Courts appears more plausible, but regional variations and the apparent dramatic rise in applications needs investigation. Why? Justice in many individual cases may be affected; equality in arms put at risk; the justice system undermined; resources diverted from those in genuine need; and tax payer money may be being spent without prudent monitoring or investigation when anomalies seem clearly evident.